Illustration

Infographics

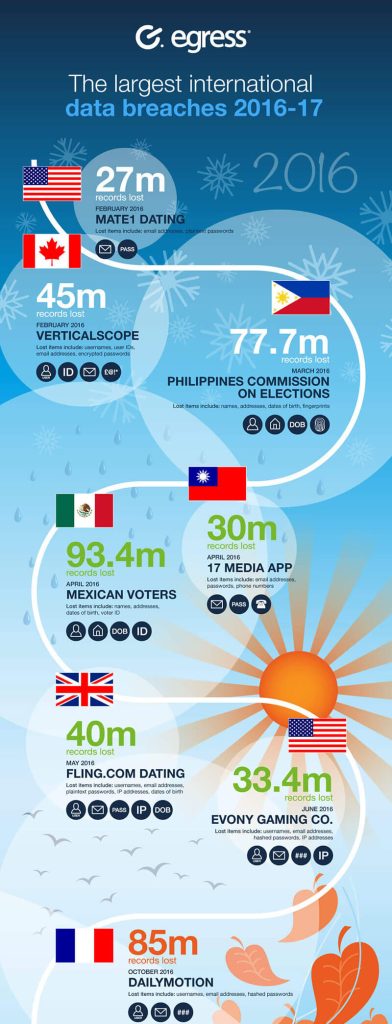
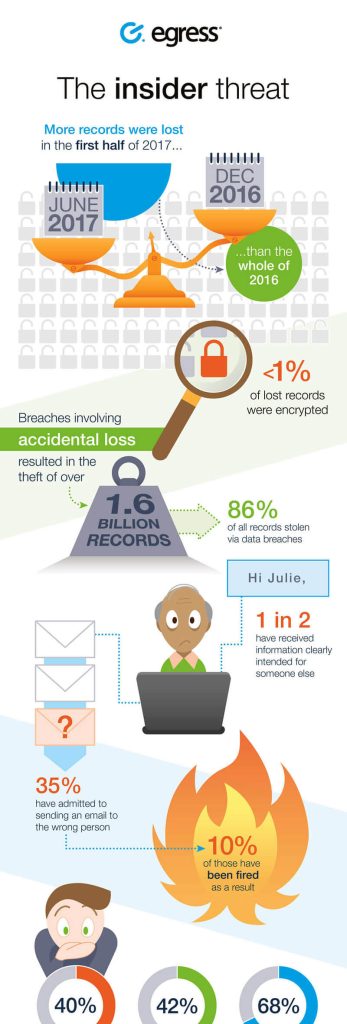
Infographics are a way of presenting data that allows sometimes complex topics to be easily digested. They need to be designed so that they present the information in the desired order, in order to avoid confusion for the viewer. The artwork is presented as social media banners, animated video and as whole infographics that would sit on a webpage that would be scrolled down to read. All the infographics on this page were designed and illustrated by myself.

Project goals:

1) To present information in a way that is both engaging and easy to follow.

Animating infographics

Infographics work well for drawing attention to your brand. These can also be diversified so that the artwork can be used in different ways. This can be by creating social media banners, but video is a popular medium for getting noticed.

This animated video was based on an infographic. It utilised the existing illustrations and added animation and audio to create a short video which was useful for use both on social media and at relevant events.

Seasons

This infographic communicates the biggest data breaches and their costs over a year. Using the line to guide the viewer through the content and using images in the background guides the viewer through the year.

 The size of the data breaches is the primary information which needed to be put across, and so these numbers stand out from the rest of the content. The addition of flags illustrates that these data breaches are a global problem.

Passwords

This infographic is designed to communicate how to create better passwords, and to illustrate what techniques attackers may use to guess a password. Although security measures might be in place to protect data, this can be put at risk by the people working with the data. Password managers and multifactor authentication (MFA) can help, however encouraging the use of strong passwords is paramount.

This infographic included illustrations relevant to each section, including a fake social media page to show what information can be used in a social engineering attack.

Accidental loss

This infographic illustrates a story of accidental loss. Some infographics include sections of data or discrete elements, but this one includes more text which needs to flow with the story. Shapes and arrows help to guide the viewer through this story, where the statistics are the key pieces of information.

Want to know more? Get in touch!

Related content

These illustrations were designed to replace screenshots used on the website. They help reinforce the brand and communicate specific features of products without losing effectiveness with unnecessary detail. 
View project >

Creating an internal brand identity, which would sit comfortably alongside the external-facing brand, as well as producing materials for internal campaigns.
View project >

The Egress brand underwent another refresh at the beginning of 2022. The requirements for the brand had been updated, where the brief was to make the brand feel ‘sophisticated’.
View project >